更新于
2026年7月26日
梯度下降#
梯度下降(Gradient Descent) 一种一阶迭代优化算法,常用于机器学习和深度学习中,用于寻找损失函数的最小值,从而让模型的预测误差达到最小。可以把它想象成在群山中寻找山谷:我们从当前位置出发,每次都沿着下降最陡峭的方向迈出一步,重复此过程直到到达最低点(局部极小值)。
代码实现#
from matplotlib import pyplot as plt
import numpy as np
from mpl_toolkits.mplot3d import Axes3D

def cost_function(w1, w2):
    J = w1 ** 2 + w2 ** 2 + 2 * w2 + 5
    return J

def compute_gradient(w1, w2):
    return [2 * w1, 2 * w2 + 2]

def gradient_descent():
    w1, w2 = -2, 3
    jump_points = [[w1, w2]]
    costs = [cost_function(w1, w2)]
    step = 0.1
    print("P:({},{})".format(w1, w2), end=' ')
    for i in range(20):
        gradients = compute_gradient(w1, w2)
        w1 = w1 - step * gradients[0]
        w2 = w2 - step * gradients[1]
        jump_points.append([w1, w2])
        costs.append(cost_function(w1, w2))
        print("P{}:({},{})".format(i + 1, round(w1, 3), round(w2, 3)), end=' ')
    return jump_points, costs

def plot_surface_and_jump_points(jump_points, costs):
    fig = plt.figure()
    ax = Axes3D(fig, auto_add_to_figure=False)
    fig.add_axes(ax)
    w1 = np.arange(-4, 4, 0.25)
    w2 = np.arange(-4, 4, 0.25)
    w1, w2 = np.meshgrid(w1, w2)
    J = w1 ** 2 + w2 ** 2 + 2 * w2 + 5
    ax.plot_surface(w1, w2, J, rstride=1, cstride=1,alpha=0.3, cmap='rainbow')
    ax.set_zlabel(r'$J(w_1,w_2)$', fontsize=12)  # 坐标轴
    ax.set_ylabel(r'$w_2$', fontsize=12)
    ax.set_xlabel(r'$w_1$', fontsize=12)
    jump_points = np.array(jump_points)
    ax.scatter3D(jump_points[:, 0], jump_points[:, 1], costs, c='black', s=50)
    plt.show()

if __name__ == '__main__':
    jump_points, costs = gradient_descent()
plot_surface_and_jump_points(jump_points, costs)运行结果#
P:(-2,3) P1:(-1.6,2.2) P2:(-1.28,1.56) P3:(-1.024,1.048) P4:(-0.819,0.638) P5:(-0.655,0.311)
P6:(-0.524,0.049) P7:(-0.419,-0.161) P8:(-0.336,-0.329) P9:(-0.268,-0.463) P10:(-0.215,-0.571)
P11:(-0.172,-0.656) P12:(-0.137,-0.725) P13:(-0.11,-0.78) P14:(-0.088,-0.824) P15:(-0.07,-0.859)
P16:(-0.056,-0.887) P17:(-0.045,-0.91) P18:(-0.036,-0.928) P19:(-0.029,-0.942) P20:(-0.023,-0.954) 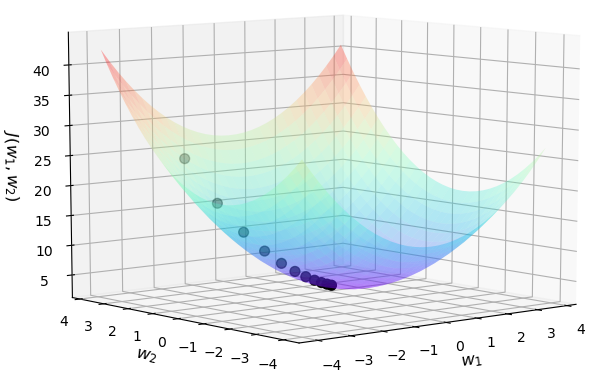
阅读
--